


A 5-rule guide that transformed unstable tracking and constantly changing KPIs into 12,701 deposits in just 3 months.
Running traffic to an iGaming app often looks like this: tracking breaks, data disappears, in-app events don’t align with actual performance, the app itself glitches, and KPIs keep shifting throughout the campaign.
If this sounds familiar, this case study is worth your attention.
Here’s a real example of how PropellerAds’ iGaming partner stabilized its funnel and generated 97,674 installs alongside 21,134 registrations within a three-month period.
Karlina Berzina, Senior Account Strategist at PropellerAds: This partner has been with us for a long time, and our collaboration goes well beyond just sourcing traffic. We have formats that let us guide users across the entire funnel: from broad reach and initial brand discovery to repeat touch points and optimization toward deposits and retention. For iGaming, this matters more than anywhere else: sustainable growth simply isn’t possible without retaining users and increasing their LTV.
That’s why our focus has shifted to being a true performance partner, not just a traffic source – one that helps advertisers work with audience quality across the full user lifecycle. To support this, we also have dedicated specialists who focus specifically on growing partners in the iGaming segment.
Below is the exact playbook used in the campaign, applicable both for affiliates running offers and teams promoting their own iGaming apps.
The Case Overview
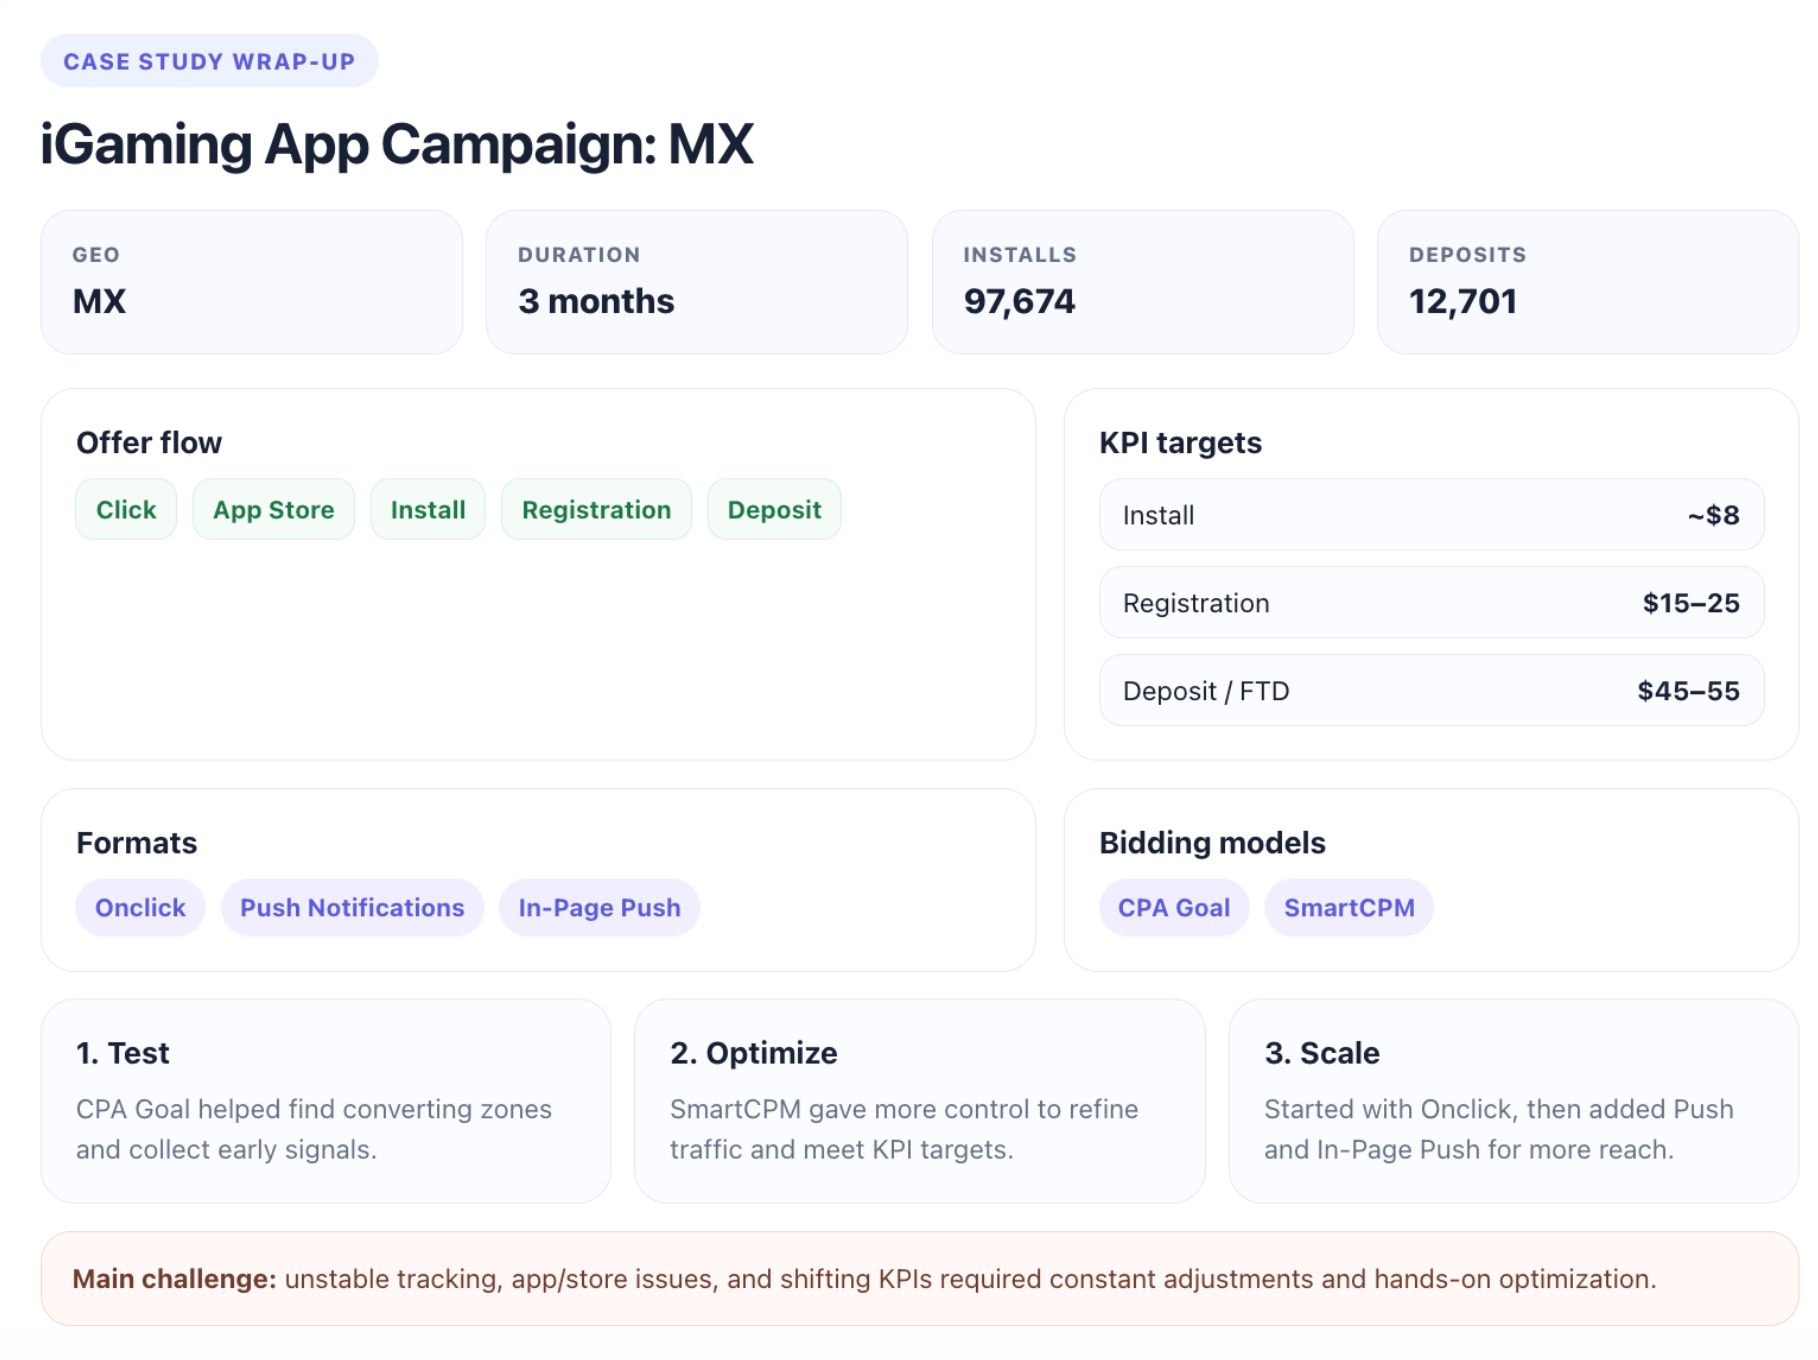
The campaign faced several major challenges from the start: inconsistent tracking, missing data, internal app and store-side issues, plus constantly changing KPIs during the campaign lifecycle. Keeping the funnel operational required ongoing adjustments and manual optimization at every stage.
At launch, the partner worked with the following KPI targets for each funnel stage:
Install: ~$8
Registration: $15–25
Deposit (FTD): $45–55
The main objective was to maintain a stable install-to-deposit funnel while keeping acquisition costs within target ranges.
Campaign Setup
Karlina: Rather than making changes too quickly, we allowed campaigns to stabilize, then continuously refined the setup by removing non-performing or less relevant traffic and focusing on segments that contributed to installs, registrations, and deposits.
Choosing the bidding model
The partner evaluated two bidding approaches:
CPA Goal — the fastest way to launch and test campaigns. It allowed the team to identify converting zones quickly, but optimization was focused only on the first conversion event, such as installs.
SmartCPM — a more advanced bidding model that provided full bid control and more precise traffic optimization, although it required significantly more manual involvement.
Instead of relying on a single setup, the partner combined both models: CPA Goal was used for testing and identifying high-performing zones, while SmartCPM handled optimization and scaling later in the process.
Karlina Berzina: This approach proved to be more effective: automation helped quickly gather data, while manual optimization allowed the team to refine results and meet the target KPIs. It became clear that it’s not the model itself that matters, but how you use it. Automation helps, but the best results come from combining both, knowing when to trust the algorithm and when to take control over it.
Choosing the format
The campaign initially launched with Onclick traffic, while CPA Goal and SmartCPM were tested simultaneously to compare performance against KPI targets.
After the initial launch stage, the setup gradually expanded with Push and In-Page Push formats to increase reach and traffic volume.
Campaign Flow: Testing and Optimization
Since the funnel included multiple stages with different KPIs, the partner followed a strict optimization structure to maintain control over performance.
First, campaigns were left untouched for at least two days to stabilize and collect realistic cost data before any optimization started. During this phase, performance was monitored across OS versions, devices, browsers, and traffic behavior to identify early patterns.
Karlina: Rather than making changes too quickly, we allowed campaigns to stabilize, then continuously refined the setup by removing non-performing or less relevant traffic and focusing on segments that contributed to installs, registrations, and deposits.
The rest of the optimization process followed several core rules.
Gradually eliminating non-converting zones
Traffic was segmented into smaller parts (i.e. zones, behavioral patterns, and performance signals) to determine whether each segment contributed to conversion goals.
If a traffic segment failed to generate value, it was excluded immediately. This gradual filtering process reduced inefficiencies and minimized wasted spend.
Using clear blacklist and whitelist rules
Beyond removing weak zones, the partner introduced a structured blacklist and whitelist system:
Rule 1: No Signal
If a zone spent more than the equivalent cost of two deposits without generating installs, registrations, or deposits, it was blacklisted immediately.
Rule 2: Empty Promise
If a zone produced large registration volumes at the cost of two deposits but failed to generate meaningful downstream actions, it was also blacklisted.
Rule 3: Proven Performer
Zones that consistently delivered efficient conversions were added to the whitelist.
The case also highlighted an important distinction between blacklisting and whitelisting. Blacklisting was reactive and immediate, while whitelisting required more time. This is because traffic quality was evaluated based on completed deposits rather than installs or registrations alone.
Respecting the conversion window
Another critical part of the strategy was analyzing user behavior and respecting the conversion window.
The team focused on questions such as:
How long do users stay engaged?
How many days after install or sign-up can conversions realistically happen?
The answers helped determine the testing window, which in most cases aligned with a 30-day period.
The optimization process itself followed two stages:
Step 1: Campaigns were given at least two days to stabilize while the algorithm gathered realistic cost data.
Step 2: After stabilization, the partner analyzed the data and applied the first filtering rule ‘No Signal’ before continuing with deeper optimization.
Adding formats gradually
As Karlina explained in the case study, scaling works more effectively when the setup is built correctly first, and expanded gradually later.
The campaign started with Onclick traffic only. Once performance became stable, Push and In-Page Push formats were added to increase reach and overall volume.
Campaigns were also separated by a bidding model for cleaner testing and optimization.

The Results and Main Takeaways
Within three months, the campaign generated:
97,674 installs
21,134 registrations
12,701 deposits
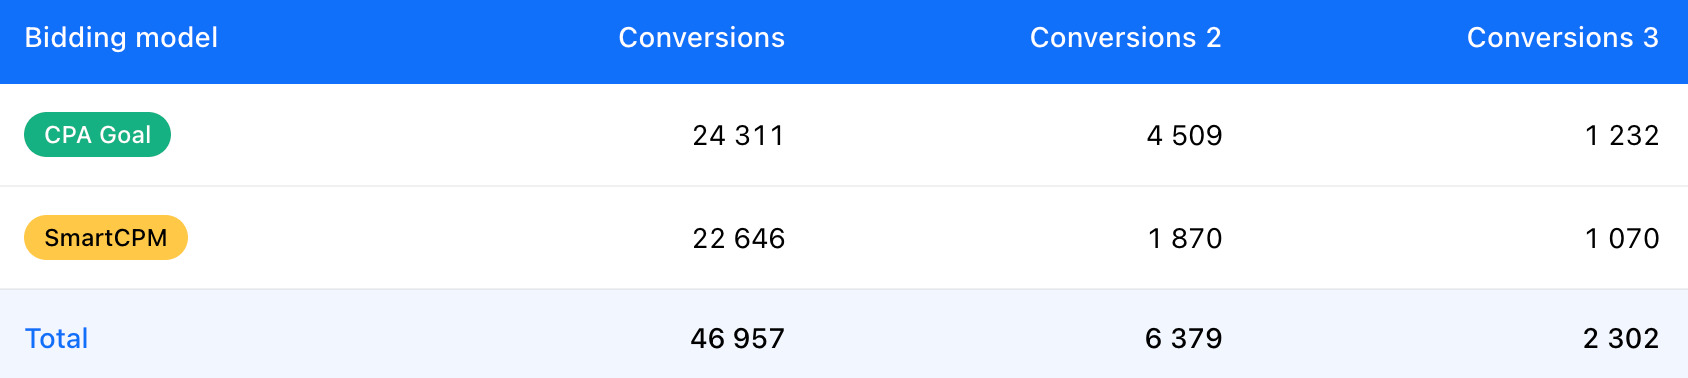
January SmartCPM vs CPA Goal
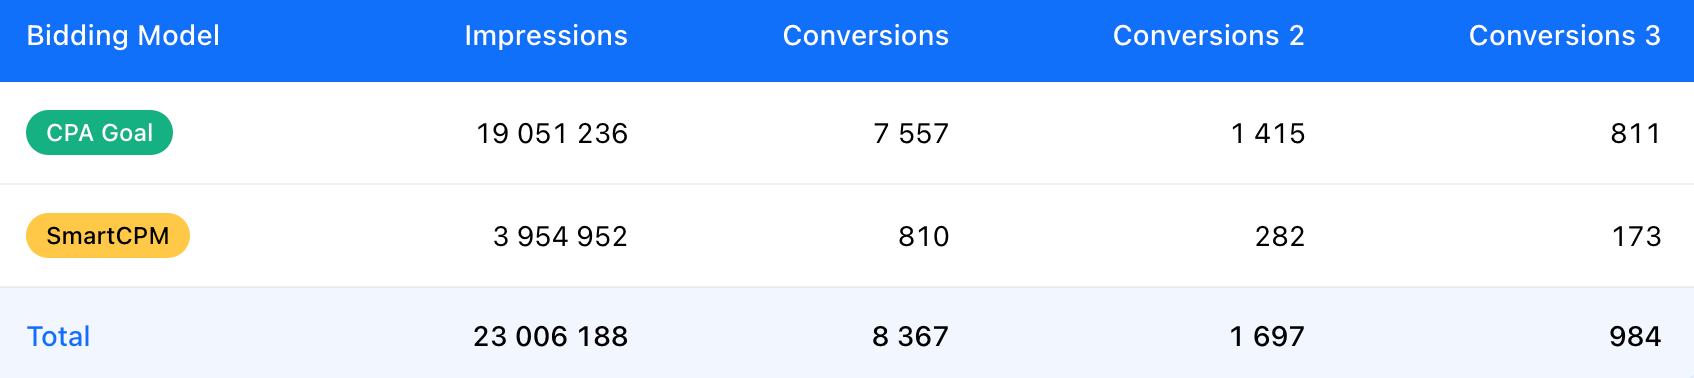
February same SmartCPM vs CPA Goal
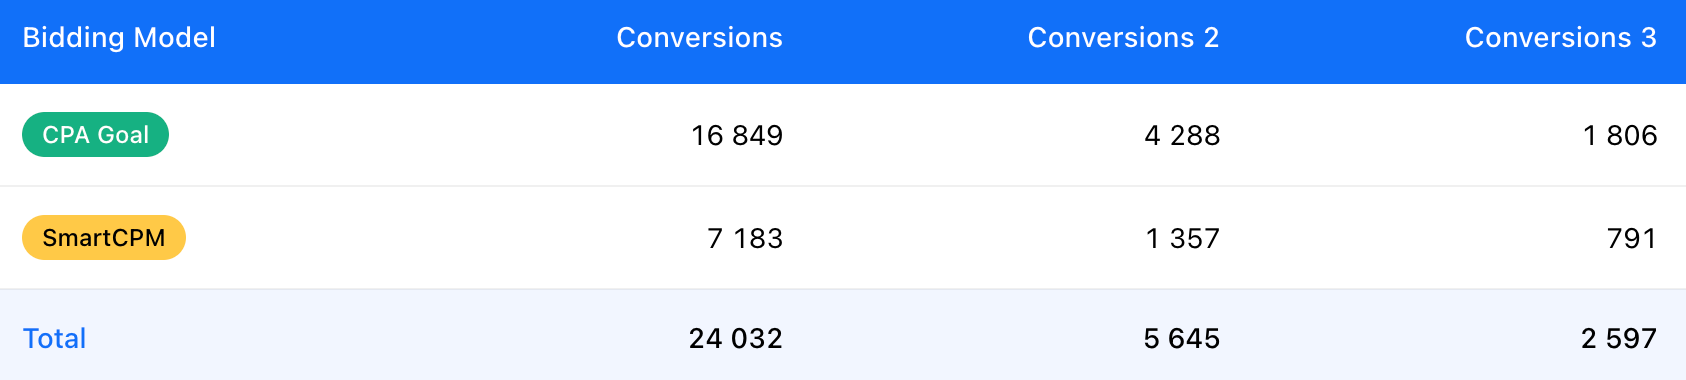
March SmartCPM vs CPA Goal (Includes a push test under CPA Goal )
The partner also reduced install costs, doubled deposit conversions, and introduced Push Notifications as an additional ad format currently showing promising early performance.

5 Rules Behind the Results
Define clear KPIs for every funnel stage to keep optimization structured.
Use CPA Goal for testing and SmartCPM for optimization and scaling.
Allow campaigns at least two days to gather data before optimizing.
Filter weak traffic early using simple rules like ‘No Signal’ and ‘Empty Promise’.
Scale gradually: start with one format and expand later with Push and In-Page Push.
Do you want to get the same results?
Use the guide and Launch Your Campaign Now!


.png)


.png)